
…in which our hero recounts his double-pronged attempt to produce a numerical figure representing the greenhouse gas emissions produced by the In the Balance exhibition at the MCA; and wonders what to do with the results…
It started here, and continued here.
And here it ends (oh, how I wish it would end here):
Having spent time with Nicky and Mark getting all the wattages for each light fixture, each video projector, and each television screen in the gallery, I was then faced with the task of adding them all up.
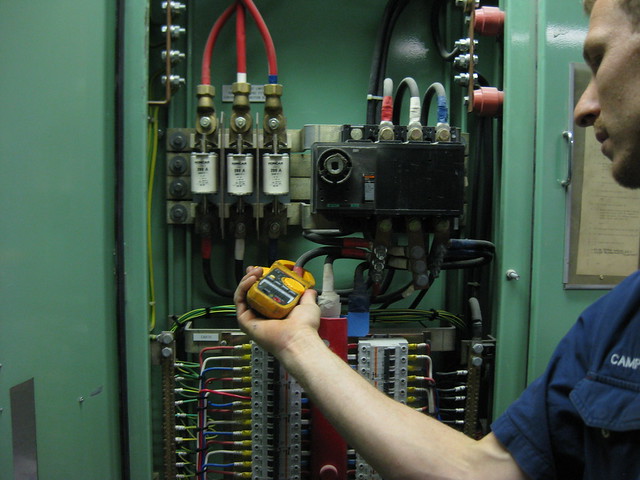
But first, Mark summoned Campbell the electrician to help out. Campbell arrived with a tool which would, potentially, make all my adding up work unnecessary: the Ammeter.
With a very excitable Mark champing at the bit, we three brave explorers plunged into the bowels of the building: concrete corridors threaded with large air-ducts and fat, colourful, dangerous-looking multicoloured cables, copper pipes – many clad with aluminium foil – ancient looking dials, and sheet metal boxes painted with turquoise enamel. A deep humming sound and an unexpectedly gusty airflow permeated these unpeopled corridors.
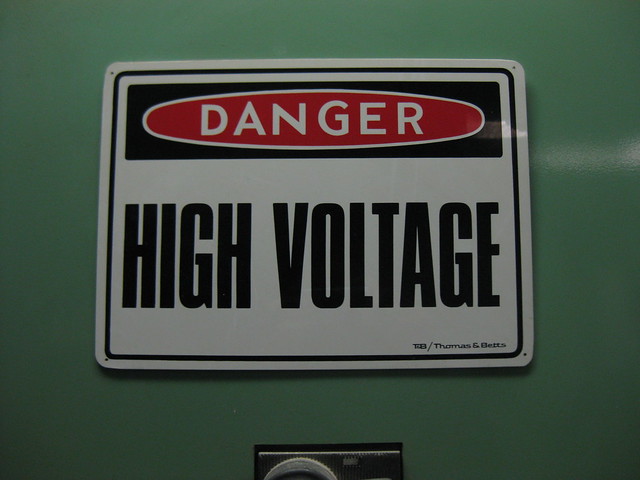
Campbell dusted off an electrical box, unscrewed the security bolts, and clamped his trusty ammeter onto the three big wires leading out of the top of it.
And here’s how it panned out…
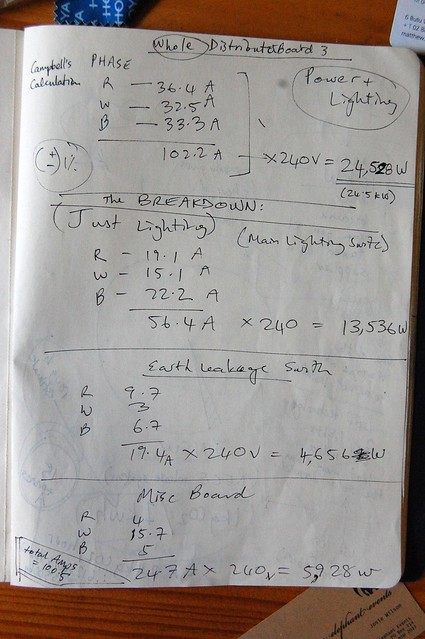
By testing and adding up all 3 “phases” of the lighting and electricity circuit, Campbell calculates that the current is 102.2 Amps:
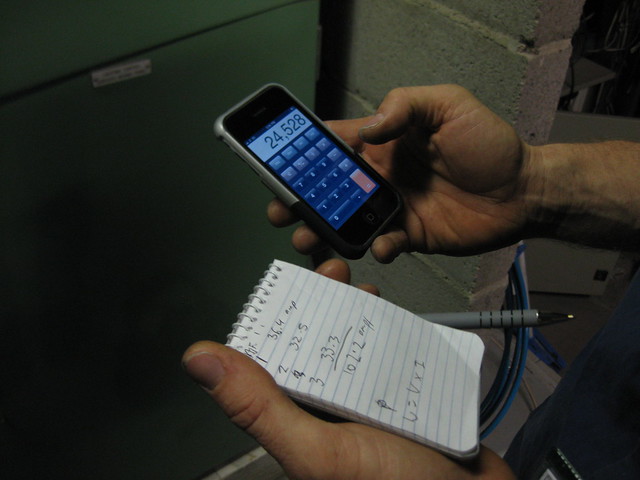
To calculate the wattage, you multiply amps by volts.
Thus the total wattage is 102.2amps x 240volts = 24528 watts:
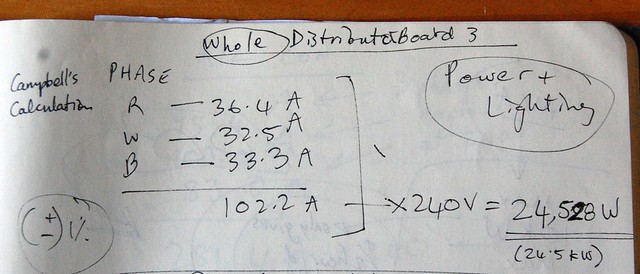
This total wattage (24,528 Watts: 25 kilowatts per hour – equivalent to running 25 of those little oil bar heaters simultaneously!) breaks down, across the different distribution boards, to about 13.5 kw per hour for lighting, and the remainder – about 10.5 kw per hour – for the video projectors, televisions and other sundries.
Campbell then turned to the separate electrical board which distributes power to the airconditioning and humidity systems. The seasoned electrician clamped his ammeter onto the wires, and then emitted a slow, low whistle. “Lucas, I don’t think you want to know this”, he said. But he told me anyway: “Air conditioning pulls more than double the power of the lighting circuits”.
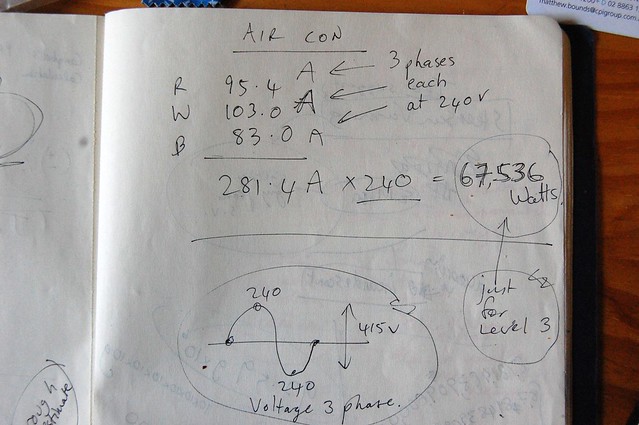
And indeed, the machinery which heats, cools, and humidifies the MCA galleries adds up to a whopping 67.5 kwH.
Remember that we’re only talking about Level 3 of the MCA, not the whole building.
Also remember that airconditioning runs 24 hours a day… We’ll return to that later…

Having discovered these sobering truths, I returned to my office. Louise, my trusty intern and I were then faced with the task of what to do with our nitpickiddly detailed survey of all the lights on Level 3. We decided to go ahead and add them all up anyway, to see how our figures matched against Campbell’s measurements.
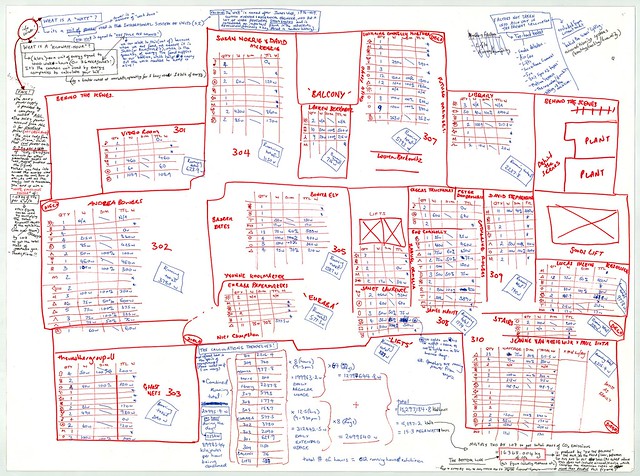
Here’s a scan of the first map of the exhibition, with all the lighting and electrical fixtures annotated (you can read the story of how it came about, if you like):
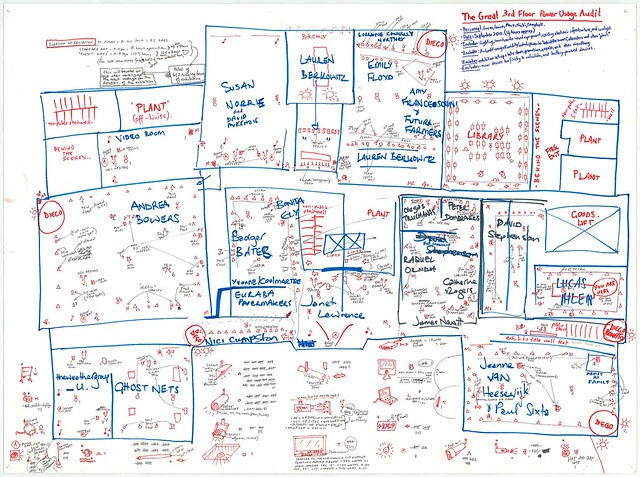
[click on the image to see it bigger…]
Since this map was getting a bit too full, we started a second map, inserting all our calculations inside each room of the exhibition. Here’s Louise filling in the data:
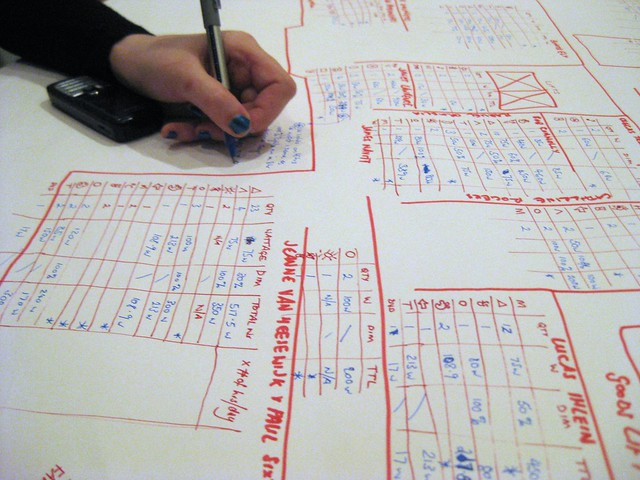
And here’s the resulting map:
[click on the image to see it bigger…]
This enabled us to tally up the wattage of each room. If you wanted, you could make a league-table of the greatest emissions in the show.
For instance, the most electricity-hungry room in the exhibition is the double-height space containing the Future Farmers, Lauren Berkowitz, Emily Floyd, and Lorainne Connelly Northey. It draws nearly 6000 watts per hour. The main reason for its large consumption is that the gallery is very tall, and so the lights deployed need to be of a very high-wattage to illuminate the space.
The highest consumption by an individual artist looks to be Andrea Bowers, whose use of multiple screens and lighting in the same space pushes work up to 3780 watts per hour.
But anyway, I’ll leave aside the analysis of individual works for the moment…
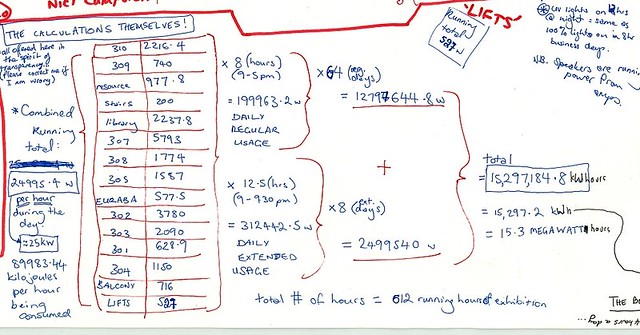
Next, Louise and I tallied up all the rooms, to give a total lighting/electricity consumption for the entire exhibition. The result: 24,995 Watts per hour…
I must say, we were very pleased with ourselves – this calculation is only 467 watts higher than the reading on Campbell’s ammeter (which Campbell himself had admitted can have a 1% margin of error).
To convert our 24,995 Watts into a total electricity consumption for the whole exhibition, we had to multiply it by the total number of hours that the lights are switched on. With a little help from Seb, who oversees the daily running of the gallery spaces, we estimated this at 612 hours. Thus by multiplying 24, 995 Watts by 612 hours, we come to a total of 15,297 kiloWatt hours (or 15.297 megaWatt hours)…
But what does this mean?
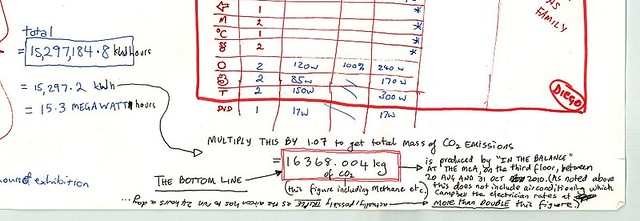
I rang AGL, the company that provides electricity to the MCA. The nice customer liason lady, Fiona, was very knowledgeable about carbon emissions and how they relate to energy usage. She informed me that the “emissions factor” generated by the power station was 0.9kg of “equivalent carbon dioxide” per kilowatt hour.
(According to Fiona, equivalent carbon dioxide (CO2-e) is a term used to bundle other, even more harmful greenhouse gases into the equation alongside the good old C02: including methane and nitrous oxide – read more on it here… )
However, this emissions factor has to be bumped up, to take into account the carbon emissions in the production of the power in the first place (mining the coal etc), as well as losses in transmission of power along the cables between the power station and the MCA. The “average total emissions factor” which results is approximately 1.07kg of CO2-e per kiloWatt hour.
THUS!
– if we multiply our total kilowatt hours by 1.07kg, we come to a total mass of greenhouse gas emissions. That number, folks, is 16,368kg – more than 16 tonnes:
If anybody is still reading this, I’m afraid we’re not quite finished yet!
To get a total which takes into account the airconditioning systems, we need to multiply the total wattage of the airconditioning (67.536 kw per hour) by the total number of hours for the exhibition. Remembering that in order to keep the artworks at a constant temperature and humidity, the airconditioning must run 24 hours a day, the total duration of this load is: 72 days x 24 hours = 1728 hours.
Thus: 1728 hours x 67.536 kw per hour = 116,702.206 kWh (or 116.702 megaWatt hours).
Using the same emissions equation as before (x 1.07kg), this tallies up to 124,871 kg of equivalent C02. In other words, to cool the gallery spaces for the In the Balance exhibition produces nearly 125 tonnes of gases – gases which will, in time, make the planet even warmer!
And finally! – if we now add up the lighting+electricity+airconditioning, we get a total greenhouse gas emission of 141,239kg.
141 tonnes.
This figure does not take into account:
-transport of artists and audience to the show
-freight of artworks
-manufacturing of the artworks
-building walls
-special events during the run of the show
-production of the catalogue
-installing and taking down the show
-any other emitting events I can’t currently call to mind
It is only for air conditioning and lighting to keep this single exhibition, on one floor of the museum, up and running during the 72 days it is scheduled to be open to the public.
What to do with all this information? I really don’t know. But right now, I am going to leave this all aside for a moment, and go listen to some AC/DC.
If you were looking at it in a cost accounting mode you would also have to allocate a fixed overheads component to account for energy usage by the admin area of the building ie work out what proportion of the MCAs total exhibition space is being taken up by this exhibition then add that proportion of admin area energy usage for the time of the exhibition. This is rough but it would notionally account for energy usage in relation to the exhibition by admin both before, after and during the exhibition. So you better get up to admin, bookshop, etc now and do all that again for all the non exhibition areas.
No rest for the wicked, eh Ian?
The maths hurts my brain, but wow o_O
and what about the poo and the water to flush it. meaning bodily functions-not the art.
indeed.
I need to move onto waterworks now, don’t I?
Lucus, yes. unfortunately I think it’s the realm of uncharted waters you now need to cross.
While this domain is often overlooked and still considered a taboo, everyone does indeed poo. And there’s nothing really environmentally friendly about it…I wonder where all of the MCA’s poo goes?
I’m sure they have collected a lot of it over the years.